
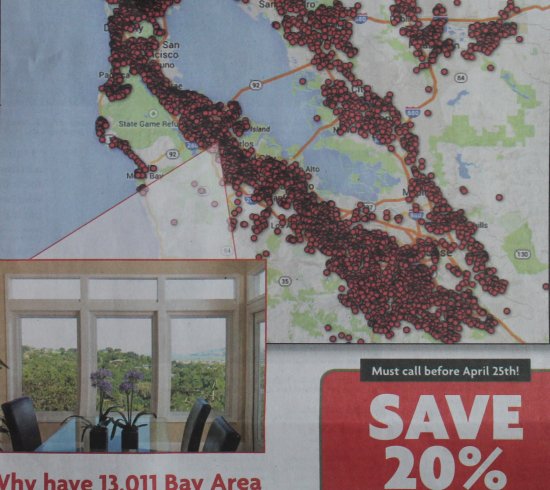
Reading Sunday's newspaper, I have found this map. What does it try to say? It turns out this is a full page ads for a windows replacement company. They are telling us that 13,011 Bay Area homeowners have chosen to use them to replace their windows. Online mapping has come a long way since they are available to the public some 10 years ago. This company could have just said they have many customers all over Bay Area in nearly every city. Instead plotting them as dots on a map looks lot more impressive. Now this becomes a Wow! rather than yet another day in business.
The first time people put their data on a map, it looks as if they have discovered some hidden pattern. Some time ago someone has created a map to explore the relation between tech shuttle stops and the opening of restaurants and cafes. He has a theory about the "Clusters of Affluence" and the newspaper covered the story. Unconvinced, I pulled some unrelated data like crime location and plotting another map overlaying violent crime and tech bus stop. It just look much the same as the restaurant map.
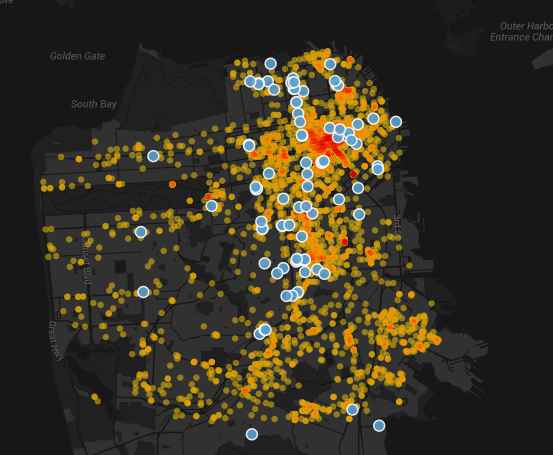
My explanation is these maps are simply showing a pre-existing population pattern, not necessary a discovery of some unknown relation. Many dots on the map may make it looks like a Wow! But it is simply yet another day in business.
2015.04.19 comments
 Site feed