
I was doing a traffic data analysis base on the vehicle location data pull from the SF Muni website. This is an extremely interesting project. I pick up a whole lot of new skills while doing this, most notably data analysis and computational geometry. The project also turns out to be a challenging one. A few months (of part time work) has gone by I still haven't nearly achieved my original vision.
Still I think I am getting better at this work. So I'm sharing some interesting data I'm working with. On one bus route I've collected 20,000 location readings on a single day. The goal is to organize them into individual vehicle trip. After a first pass, the data are reduced to 336 trips. But how good is the quality of data? And how good is my trip segregation algorithm? So I plotted the trips' distance against their duration on a chart. The graph quickly helped me to evaluate the quality of the result.
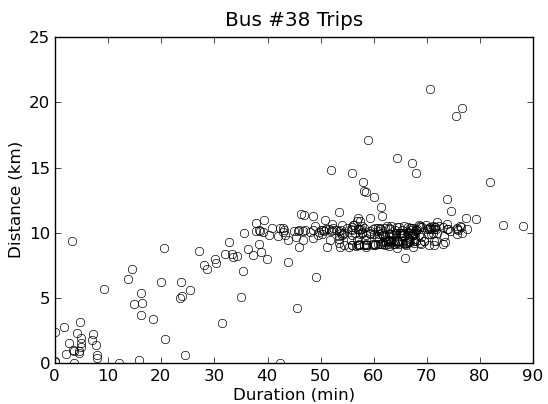
The first impression is the result looks fairly good. A dense band of points shows that most trip length is about 10 km, and they takes about 40-75 minutes. This seems to match real world experience. At the lower left hand corner is a number of trips that last very short time and cover very little distance. I'll probably treat them as noise and discard them. A curiosity is some trips seem to cover a long distance from 15 to 20 km, much long than the official route. Where did they went?
Closer examination on their track reveal the problem. These are all legitimate eastbound trips. However the bus starts from a depot in the middle of the city. They went all the way to the terminal in the west end. Only from there the real eastbound trip begins. The challenge for me is I'm only interested in the eastbound portion. The trip from the depot to the west end is actually data pollution. I need to find a way to handle these extraneous data.
This still leaves a scatter of points of around 5 km long and last 15 to 35 minutes to inspect. Meanwhile I have difficulty to examine the track because Google Earth is crashing on me all the time. I guess this is a good time to turn away from technical work and to write a blog instead.
2010.09.02 - comments
 Site feed